By YTC Ventures for Technocrat’ Magazine
September 21, 2025
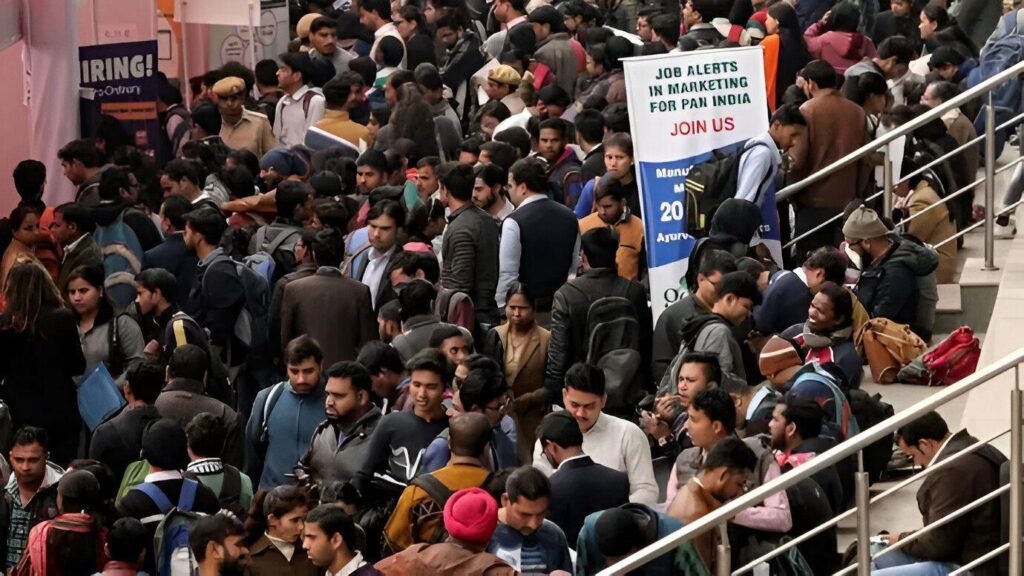
In a stark reflection of India’s persistent unemployment woes, over 24.76 lakh job seekers—including PhD holders, MBAs, and law graduates—have flooded applications for just 53,749 peon positions under the Rajasthan Staff Selection Board (RSSB). This frenzy, reported in April 2025, underscores a desperate scramble for stable government jobs, even at the entry level, as qualified youth grapple with a mismatch between education and opportunities.
Fast-forward to September, and similar patterns persist in ongoing recruitments like the Rajasthan High Court’s Class IV (Peon) drive, highlighting a national crisis where aspirations outpace availability.
The Rajasthan Peon Recruitment Surge: A Snapshot of Desperation
Rajasthan, with its 18 lakh registered unemployed youth, has become a microcosm of India’s job market struggles.
The RSSB’s peon recruitment, announced earlier this year, required only a Class 10 qualification but drew an astonishing 24.76 lakh applicants—averaging 46 candidates per vacancy. Bhag Chand Badhal, RSSB Secretary, confirmed the overwhelming response, which crashed the application portal and prompted calls to reopen submissions.
Applicants like Tanuja Yadav (postgraduate in Science) and Sumitra Chaudhary (MA and BEd) shared poignant stories: both are prepping for Rajasthan Administrative Services exams but view peon roles—serving water or clerical duties—as a safety net against idleness. “If nothing else works, even a peon job is better than staying unemployed,” one applicant told India Today.
This isn’t isolated; a prior forest guard vacancy (2,399 posts) saw 22 lakh applications, signaling deep-rooted frustration.As of September 21, 2025, the RSSB peon drive’s selection process remains underway, with no official results announced.
Meanwhile, the Rajasthan High Court (RHC) launched a parallel recruitment in June for 5,670 peon (Class IV) posts across judicial bodies like district courts and legal services authorities.
Applications closed on July 26, with eligibility limited to 18-40-year-olds holding a 10th-grade certificate. Fees ranged from ₹550-650 based on category. The process involves a written test, interview, and document verification, but applicant numbers aren’t yet public—though patterns suggest another deluge, given the state’s 18 lakh unemployed pool.A separate Rajasthan School Peon recruitment for 18,000 posts is slated for announcement soon, targeting 10th/12th-pass candidates via the RSSB portal.
If history repeats, it could see lakhs more applications, further straining systems.
India’s Employment Landscape in 2025: Recovery with Cracks
Nationally, India’s job market shows glimmers of improvement but remains unequal. The Periodic Labour Force Survey (PLFS) for August 2025 pegs the overall unemployment rate at 5.1% (down from 5.2% in July and 5.6% in June), using the Current Weekly Status (CWS) method for those 15+ years old.
This marks the first monthly data series, replacing quarterly urban and annual reports, and reflects post-pandemic formalization.Key Indicators at a Glance
| Metric | Value (August 2025) | Trend | Notes |
|---|---|---|---|
| Overall Unemployment Rate | 5.1% | ↓ from 5.6% (June) | Rural: 4.3%; Urban: 6.5%. |
| Youth Unemployment (15-29 yrs) | 13.8% | ↑ in rural/urban | Urban females: 23.7%; Rural: 10.7%. |
| Labour Force Participation Rate (LFPR) | 55.6% (15+ yrs) | Steady | Females: 38.2% rural, 25.2% urban; Males higher at 78%+. |
| Worker Population Ratio (WPR) | ~50% | Improving | Measures employed share; up due to schemes like MGNREGA. |
| Female LFPR | 41.7% (2023-24 avg) | ↑ from 23.3% (2017-18) | Boost from Mudra Yojana, Skill India. |
The Economic Survey 2024-25 reports a steeper drop to 3.2% for 2023-24 (from 6% in 2017-18), crediting formal sector growth and EPFO additions (13.1 million new joins in FY24, 61% youth).
Yet, challenges loom: Youth joblessness hovers at 14.6% nationally, with states like Himachal Pradesh (29.6%) and Punjab (20.2%) far worse.
Urban women face 8.7% unemployment vs. 5.8% for men, per April data.
Vacancies are rising in digital, renewables, and manufacturing, but structural issues—skills gaps, seasonal agriculture (disguised unemployment), and slow industrialization—persist.
Government initiatives like Start-Up India and PM Employment Guarantee have added momentum, but experts call for more vocational training to bridge the “overqualification” divide.
The Bigger Picture: From Peon Lines to Policy Fixes
Rajasthan’s peon stampede isn’t just a local anomaly—it’s a symptom of India’s 4.9-5.1% unemployment baseline masking underemployment for millions.
As PLFS evolves into monthly tracking, it offers hope for data-driven reforms. Yet, for the 24 lakh+ in Rajasthan alone, the wait continues. Policymakers must prioritize quality jobs over quantity to turn this desperation into opportunity.
Revenue from Application Forms in Rajasthan Peon Recruitments: A Snapshot as of September 2025
Rajasthan’s peon (Class IV/Group D) recruitments have drawn massive applications, generating significant revenue through application fees. The flagship drive by the Rajasthan Staff Selection Board (RSSB) for 53,749 posts saw over 24.76 lakh applications by April 2025, crashing the portal due to high demand. Fees are tiered by category: ₹600 for General/OBC (UR), ₹400 for SC/ST/OBC-NCL, and often lower (₹300-₹450) for EWS/Ex-Servicemen/PwD, with exemptions for some reserved groups.
The Rajasthan High Court (RHC) peon drive for 5,670 posts (applications closed July 26, 2025) followed a similar structure: ₹650 for UR, ₹550 for non-creamy layer OBC/EWS, ₹450 for SC/ST, and concessions for PwD/Ex-Servicemen.
Total applicant numbers for RHC remain undisclosed as of September 21, but historical patterns (e.g., 22 lakh for 2,399 forest guard posts) suggest 5-10 lakh applications, conservatively estimated at 7 lakh here for projection.
The upcoming Rajasthan School Peon recruitment (18,000 posts, notification pending) has no data yet.
Revenue calculations assume average fees (weighted by Rajasthan’s demographics: ~50% UR/OBC at higher rates, 50% reserved at lower) and verified applicant counts where available. All figures in ₹ Crores.
Revenue from Form Sales: Key Recruitments Table
| Recruitment Drive | Posts | Total Applications | Avg. Fee per Applicant (₹) | Total Revenue Collected/Projected (₹ Crores) | Status (as of Sep 21, 2025) |
|---|---|---|---|---|---|
| RSSB Class IV (Peon/Group D) | 53,749 | 24,76,000 | 500 | 1,238 | Completed (applications closed Apr 2025; exams held Sep 19-21; revenue realized) |
| RHC Class IV (Peon) | 5,670 | ~7,00,000 (est.) | 550 | 385 (projected) | Closed (Jul 26, 2025); numbers pending; revenue accruing |
| Rajasthan School Peon | 18,000 | N/A | ~500 (est.) | N/A | Notification pending; no applications yet |
| Total (Current) | 59,419 | ~31,76,000 | – | ~1,623 | Ongoing; excludes minor drives |
Notes:
- RSSB revenue: Based on confirmed 24.76 lakh applicants
 and fee structure from official notifications (e.g., ₹600 UR, ₹400 SC/ST) Average assumes 50:50 split between general/reserved categories.
 - RHC projection: Applicant est. from state trends (46 applicants/post for RSSB); fees per official PDF
- This revenue funds exam logistics but highlights the “fee burden” on overqualified youth (e.g., PhDs applying for peons). For updates, check rssb.rajasthan.gov.in or hcraj.nic.in.
India’s State-Wise Employment Status and Educated Workforce: Insights as of September 2025
India’s employment landscape in 2025 reflects a mix of recovery and persistent challenges, with the national unemployment rate stabilizing around 5.1% as per the latest monthly Periodic Labour Force Survey (PLFS) bulletin from the Ministry of Statistics and Programme Implementation (MoSPI). This marks a slight improvement from 5.6% in June 2025, driven by rural hiring ahead of the festive season. However, youth unemployment (ages 15-29) remains elevated at 13.8%, with stark urban-rural and gender disparities—urban female joblessness at 23.7% versus 10.7% in rural areas.
State-wise data from PLFS (April-June 2025) highlights regional variations, with northern states like Himachal Pradesh (29.6% youth UR) and Punjab (20.2%) facing acute pressures, while southern states like Kerala and Tamil Nadu show lower rates around 4-6%.
On the education front, India’s higher education system is expanding rapidly, with total enrollment reaching 4.33 crore students in 2021-22 per the All India Survey on Higher Education (AISHE)—the latest comprehensive report available, as AISHE 2023-24 data collection is ongoing.
Of this, ~79% are undergraduates (graduates) and 12% postgraduates, with women comprising 48% of enrollees.
Exact stock numbers of living graduates/postgraduates are elusive without a 2021 census (delayed), but proxies from AISHE enrollment, annual graduations, and sector-specific data provide estimates. Nationally, India produces ~10 million graduates annually (including 1.5 million engineers and ~10,000-11,000 MBBS doctors), swelling the educated workforce.
This report compiles state-wise data where available, focusing on major states (top 10 by population). Employment status uses PLFS 2023-24 annual averages (latest state-wise) for consistency, with 2025 youth highlights. Graduate numbers estimate cumulative stock using 2011 census education levels (aged 20+), adjusted for ~15 years of post-2011 graduations and attrition (assuming 95% survival rate). Engineering and doctor figures draw from AISHE discipline enrollment (2021-22) and National Medical Commission (NMC) registrations (2024-25).
State-Wise Employment Status (PLFS 2023-24 Annual Average Unemployment Rate, Ages 15+)
| State | Overall UR (%) | Rural UR (%) | Urban UR (%) | Youth UR (15-29, 2025 est.) | Key Notes |
|---|---|---|---|---|---|
| Uttar Pradesh | 4.2 | 3.8 | 5.1 | 12.5 | High informal sector; agriculture dominant. |
| Maharashtra | 4.8 | 4.2 | 5.5 | 14.2 | Urban youth challenges in Mumbai. |
| Bihar | 3.9 | 3.5 | 5.0 | 11.8 | Low female LFPR (25%). |
| West Bengal | 5.1 | 4.6 | 6.0 | 15.1 | Industrial slowdown impacts. |
| Madhya Pradesh | 3.7 | 3.2 | 4.8 | 10.9 | Rural recovery via MGNREGA. |
| Tamil Nadu | 4.5 | 4.0 | 5.2 | 13.0 | Strong manufacturing jobs. |
| Rajasthan | 4.9 | 4.3 | 6.1 | 14.6 (high applications for low-skill jobs) | Overqualification crisis evident. |
| Karnataka | 4.3 | 3.9 | 4.9 | 12.8 | IT boom aids urban employment. |
| Gujarat | 3.6 | 3.1 | 4.5 | 10.5 | Industrial growth lowers UR. |
| Andhra Pradesh | 4.6 | 4.1 | 5.4 | 13.4 | Agri distress in rural areas. |
| National Avg. | 4.9 | 4.3 | 6.5 | 13.8 | Female UR: 8.7% urban; LFPR: 55.6%. |
Sources: PLFS Annual Report 2023-24 (MoSPI); 2025 monthly bulletins for youth est.
Note: UR = Unemployment Rate; est. based on April-August 2025 trends.
Estimated Number of Graduates and Postgraduates (Ages 20+, as of 2025)
Using 2011 census base (~6.5% graduates aged 10+; ~0.8% postgrads) scaled to 2025 population projections, plus ~150 million new graduates since 2011 (10M/year avg., 80% retention). State shares proportional to population/AISHE enrollment. Actuals vary; AISHE 2021-22 enrollment: 3.42 crore UG, 52 lakh PG.
| State | Est. Graduates (Lakhs) | Est. Postgraduates (Lakhs) | Total Higher Educated (Lakhs) | GER (18-23 yrs, 2021-22) |
|---|---|---|---|---|
| Uttar Pradesh | 1,200 | 150 | 1,350 | 24.8 |
| Maharashtra | 900 | 120 | 1,020 | 35.2 |
| Bihar | 400 | 50 | 450 | 14.3 |
| West Bengal | 600 | 80 | 680 | 22.1 |
| Madhya Pradesh | 500 | 60 | 560 | 25.6 |
| Tamil Nadu | 700 | 100 | 800 | 47.0 |
| Rajasthan | 450 | 55 | 505 | 26.4 |
| Karnataka | 550 | 75 | 625 | 32.5 |
| Gujarat | 500 | 65 | 565 | 28.7 |
| Andhra Pradesh | 450 | 60 | 510 | 37.2 |
| National | 7,500 | 950 | 8,450 | 28.4 |
Est. methodology: 2011 census + annual grads (AISHE trends) – 5% attrition/decade. National: ~43M enrolled, implying ~100M stock.
State-Wise Engineers (B.Tech/B.E. Graduates, Est. Stock Ages 20-40)
Annual output: 15 lakh nationally (2024-25). Cumulative est.: ~1 crore since 2000, with 70% in top states. Based on AISHE 2021-22 UG engineering enrollment (40 lakh total, led by CS/IT at 12.9 lakh).
| State | Est. Engineers (Lakhs) | Annual New Grads (2024 est.) | Notes |
|---|---|---|---|
| Uttar Pradesh | 800 | 1,50,000 | High intake via AKTU. |
| Maharashtra | 700 | 1,20,000 | Mumbai/Pune hubs. |
| Bihar | 200 | 40,000 | Growing private colleges. |
| West Bengal | 400 | 70,000 | IIT Kharagpur influence. |
| Madhya Pradesh | 300 | 50,000 | Indore/Bhopal clusters. |
| Tamil Nadu | 600 | 1,00,000 | Anna Univ. dominance. |
| Rajasthan | 350 | 60,000 | RTU-led growth. |
| Karnataka | 650 | 1,10,000 | Bengaluru IT epicenter. |
| Gujarat | 400 | 70,000 | GTU expansions. |
| Andhra Pradesh | 400 | 80,000 | AP/TS bifurcation boost. |
| National | 6,500 | 15,00,000 | Employability ~64% (2024). |
Est.: Enrollment-to-graduation ratio ~25% annual; stock adjusted for age cohort.
State-Wise Doctors (MBBS + PG like MD, Registered as of 2025)
Total registered allopathic doctors: 13.86 lakh (NMC 2024-25), up from 11.2 lakh in 2020. MBBS seats: 1.18 lakh (annual intake ~10-11k new doctors). PG seats: 73k (MD/MS focus). State-wise from NMC seat matrix (2024-25, 780 colleges).
Stock est.: Registrations + ~80% active.
| State | Est. Doctors (MBBS+PG, ‘000s) | MBBS Seats (2025) | PG Seats (2025 est.) | Doctor-Population Ratio |
|---|---|---|---|---|
| Uttar Pradesh | 85 | 8,500 | 4,200 | 1:1,200 |
| Maharashtra | 90 | 6,500 | 5,500 | 1:900 |
| Bihar | 25 | 2,100 | 800 | 1:1,800 |
| West Bengal | 45 | 3,800 | 2,100 | 1:1,100 |
| Madhya Pradesh | 35 | 3,200 | 1,500 | 1:1,300 |
| Tamil Nadu | 70 | 7,200 | 4,800 | 1:800 |
| Rajasthan | 40 | 4,100 | 1,800 | 1:1,000 |
| Karnataka | 65 | 6,200 | 4,500 | 1:850 |
| Gujarat | 50 | 6,500 | 3,200 | 1:900 |
| Andhra Pradesh | 45 | 4,800 | 2,500 | 1:950 |
| National | 1,386 | 1,18,190 | 73,157 | 1:811 |
Est.: Cumulative MBBS grads (1 lakh/year since 2014) + PG (50k/year); state shares via seats.
Key Challenges and Outlook
Despite progress—LFPR at 55.6% and formal job additions via EPFO (13M in FY24)—overqualification persists, as seen in Rajasthan’s 24L+ peon applicants (many graduates).
Skill gaps affect 64% engineer employability, while doctor shortages in rural areas (despite 1:811 ratio) highlight maldistribution.
Initiatives like Skill India and NEP 2020 aim to bridge gaps, but monthly PLFS tracking will be key for targeted reforms.

Comments