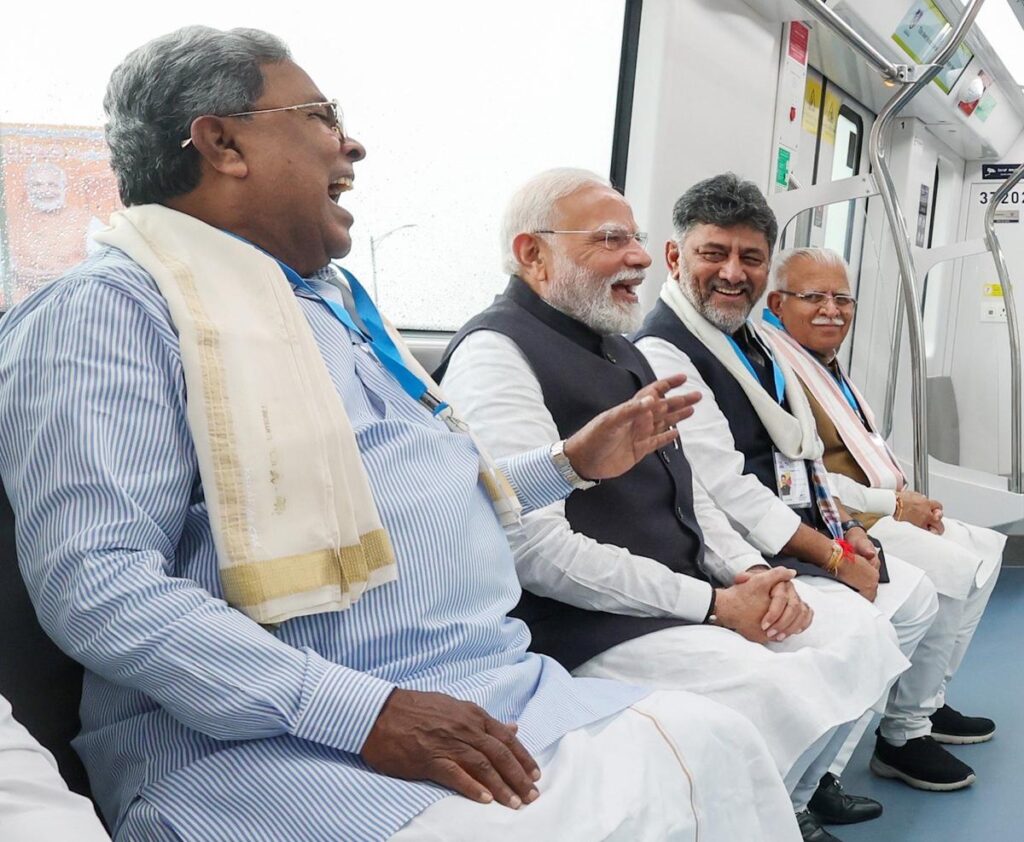
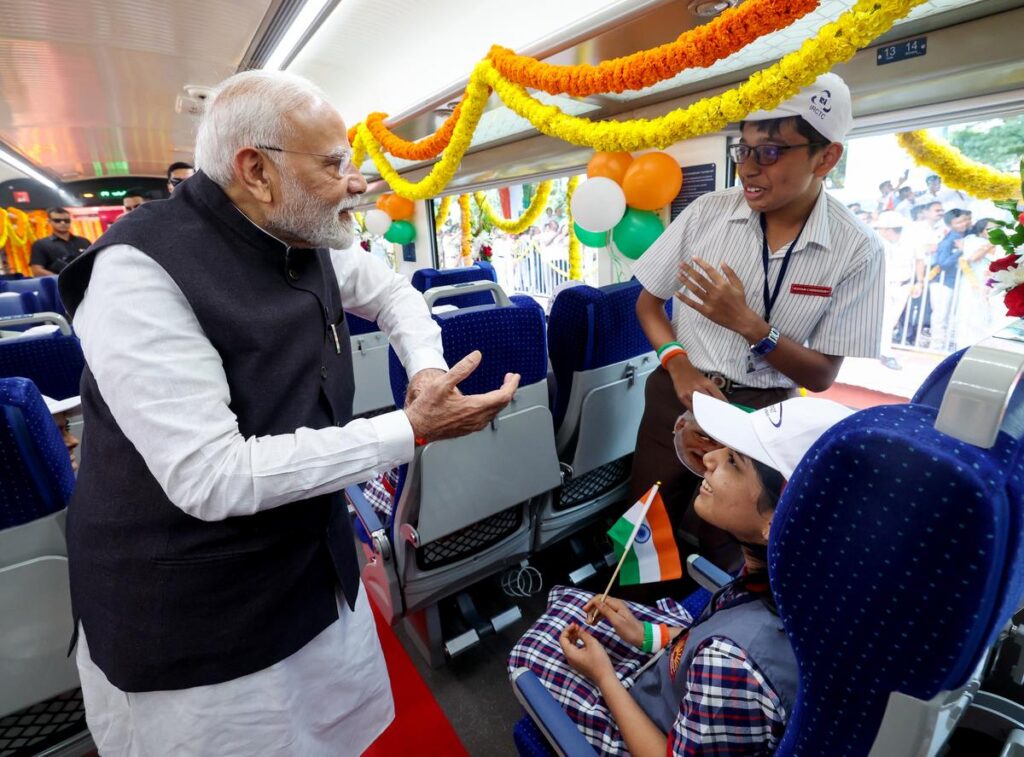
On August 10, 2025, Prime Minister Narendra Modi inaugurated the long-delayed Yellow Line, expanding Bengaluru’s Namma Metro to 96.1 km, making it India’s second-longest metro network after Delhi. This 19.15-km corridor from R.V. Road to Bommasandra marks a pivotal moment in easing Bengaluru’s traffic woes.
This Technocrat article provides a comprehensive analysis of Namma Metro’s founding, phase-wise growth, costs, revenues, passenger statistics, leadership changes, and its alignment with the Make in India initiative, alongside a breakdown of imported versus domestically sourced components.
Founding History
The vision for Namma Metro began in 1977 when the State Town Planning Department recommended a mass rapid transit system to address Bengaluru’s growing congestion. In 1981, Southern Railway proposed a two-corridor, 80-km metro with commuter and ring railways. A 1993 state committee echoed this, leading to the creation of Bangalore Mass Rapid Transit Ltd (BMRTL) in 1994.
BMRTL’s 300-km light rail transit (LRT) plan failed to materialize due to public-private partnership challenges. In 2003, the Karnataka government enlisted the Delhi Metro Rail Corporation (DMRC) to design a metro modeled on Delhi’s success. The 2004 approval of a 33-km Phase 1, later expanded to 42.3 km, birthed the Bengaluru Metro Rail Corporation Limited (BMRCL), a joint venture of the Government of India and Karnataka. The foundation stone was laid by then-Prime Minister Dr. Manmohan Singh on June 24, 2006, with construction starting in 2007.
Phase-Wise Growth
Namma Metro’s growth has unfolded in phases, addressing Bengaluru’s expanding urban needs:
- Phase 1 (2011-2017): Spanning 42.3 km with 40 stations, Phase 1 included the Purple Line (18.1 km, 17 stations, east-west) and Green Line (24.2 km, 24 stations, north-south), intersecting at Majestic’s underground station. The first section (Reach 1, Baiyappanahalli to M.G. Road) opened on October 20, 2011, followed by staged openings, with full completion in June 2017. Cost: ₹11,609 crore. Challenges included geological complexities for underground sections and tree-felling controversies.
- Phase 2 (2017-2025): Adding 75.06 km and 61 stations, Phase 2 includes extensions to Purple and Green Lines, the Yellow Line (R.V. Road to Bommasandra), and the Pink Line (Kalena Agrahara to Nagawara, due March 2025). The Yellow Line, opened August 11, 2025, covers 19.15 km with 16 elevated stations. Phase 2’s total operational length is 96.1 km as of August 2025, with further extensions planned by 2026. Cost: ₹30,695 crore. Delays stemmed from land acquisition, COVID-19, and rolling stock supply issues.
- Phase 2A and 2B (Ongoing): The 58.19-km ORR-Airport corridor, costing ₹14,788 crore, will extend the network to 176 km by June 2026.
- Phase 3 (Approved): Approved in 2024, this 44.65-km expansion, costing ₹15,611 crore, includes two elevated corridors (J.P. Nagar to Kempapura and Hosahalli to Kadabgere) with 31 stations, targeting completion by 2028. A 37-km Phase 3A (Sarjapura to Hebbal) is under planning.
The network aims to reach 317 km by 2031 under Bengaluru’s Comprehensive Mobility Plan.
Total Cost of Yellow Line
The Yellow Line, a 19.15-km elevated corridor with 16 stations, cost ₹7,610 crore, per Karnataka Deputy CM DK Shivakumar, though some sources cite ₹5,263.1 crore for core infrastructure, escalating due to delays and additional works. Funding included ₹15,000 crore for Phase 2 from state (30%) and central (20%) governments, with ₹9,000 crore in loans. Biocon and Infosys contributed ₹100 crore each for specific stations.

Land acquisition alone cost ₹1,843 crore, with civil works, rolling stock, and signaling adding to the total.
Cost of Namma Metro by Line Color
- Purple Line (Phase 1): 18.1 km, ₹5,500 crore (approximate, part of Phase 1’s ₹11,609 crore).
- Green Line (Phase 1): 24.2 km, ₹6,109 crore (approximate, part of Phase 1).
- Yellow Line (Phase 2): 19.15 km, ₹7,610 crore.
- Pink Line (Phase 2, under construction): 21.26 km, estimated ₹6,000 crore (part of Phase 2’s ₹30,695 crore).
- Blue Line (Phase 2A/2B, ORR-Airport, under construction): 58.19 km, ₹14,788 crore.
- Total Phase 1 and 2 Cost: ₹42,304 crore (Phase 1: ₹11,609 crore; Phase 2: ₹30,695 crore). Phase 3’s ₹15,611 crore will push cumulative costs higher.
Revenues and Profits
Namma Metro achieved its first profit in 2022-23, recording ₹40 crore, with revenues of ₹594.02 crore surpassing maintenance costs. This marked a recovery from pandemic-era losses. By July 2024, daily ridership averaged 7,62,361, generating significant fare revenue. A fare hike on February 9, 2025, increased ticket prices by up to 71%, making Namma Metro India’s costliest metro.
This led to a ridership dip and public backlash, with concerns about reduced public transport use. Initial revenue from the Yellow Line is projected at ₹15 lakh daily with 25,000 passengers. Cumulative revenue data for 2023 was ₹232.8 million from 232.8 million passengers.
Passengers Served
- Phase 1 (2011-2017): Initial ridership in 2011 was 25,401 daily on the Purple Line, growing to 4,50,000 daily by September 2019. By March 2024, daily ridership across Phase 1 was 6,36,000.
- Phase 2 (2024-2025): As of July 2024, daily ridership reached 7,62,361, with a peak of 9,20,562 on December 6, 2024. The Yellow Line is expected to serve 8 lakh riders daily. Annual ridership in 2023 was 232.8 million.
- Total Passengers (2011-2025): Estimated at over 500 million, with precise figures pending updated BMRCL reports.
Ticket Sales
Ticket sales include smart cards, QR code-based tickets, paper tickets, and digital payments, with fares ranging from ₹15 to ₹85 on the Yellow Line. In Phase 1’s first 12 days (2011), ₹1 crore was earned from 2,00,000 passengers.
The Green Line’s northern section (2014) generated ₹1.5 crore in its first month from 7.62 lakh passengers. The 2025 fare hike increased revenue but reduced ridership, with Yellow Line tickets projected to contribute ₹15 lakh daily. Exact ticket sale volumes are unavailable, but digital ticketing has boosted cashless transactions.
Revenue Matrix Table
| Year | Daily Ridership | Annual Ridership (Million) | Revenue (₹ Crore) | Profit (₹ Crore) | Notes |
|---|---|---|---|---|---|
| 2011 | 25,401 | 2 (partial year) | 1 (12 days) | – | Purple Line opening, Reach 1 |
| 2014 | 24,605 (Green) | 7.62 (Green, 1 month) | 1.5 (Green) | – | Green Line northern section opening |
| 2019 | 4,50,000 | ~150 | ~400 | – | Pre-COVID peak |
| 2022-23 | 5,50,000 | 200 | 594.02 | 40 | First profit, post-COVID recovery |
| 2024 | 7,62,361 | 232.8 | ~600 | ~40 | Phase 2 expansions, fare hike impact |
| 2025 (Proj) | 8,00,000 | 250 | ~650 | ~50 | Yellow Line, 25K daily riders projected |
Note: Figures are approximate, based on BMRCL data and media reports. 2025 projections assume Yellow Line ridership growth.
CEO and Leadership Changes
BMRCL’s leadership has seen several transitions:
- N. Sivasailam (2007-2017): First Managing Director, oversaw Phase 1’s completion.
- Pradeep Singh Kharola (2017-2018): Managed early Phase 2 and Green Line openings.
- Ajay Seth (2018-2020): Guided Phase 2 expansions amid land acquisition challenges.
- A.S. Shankar (2020-2022): Navigated COVID-19 delays and rolling stock issues.
- Maheshwar Rao (2022-Present): Current MD, oversaw Yellow Line completion and Phase 3 approval. Leadership stability has been critical, with Rao’s tenure focusing on operational efficiency and Make in India integration.
Make in India OEM Percentage
The Yellow Line’s rolling stock, supplied by CRRC Nanjing Puzhen in partnership with Titagarh Rail Systems Limited (TRSL), achieves 75% local manufacturing, per contract terms. One prototype train was made in China, but subsequent sets are assembled in India, aligning with Make in India goals. Civil works, including viaducts and stations, were executed by Indian firms like ITD Cementation India and HCC-URC JV, ensuring near-100% local sourcing for construction.
Signaling (CBTC) and electrification (750V DC third rail) involve imported technology from Siemens and Linxon India, but local assembly accounts for 60-70% of components. Overall, Namma Metro’s OEM sourcing is approximately 80% Make in India, with rolling stock and civil works driving localization.
Major Imported Construction Equipment, Technology, and Hardware
- Tunnel Boring Machines (TBMs): For Phase 1’s underground sections, TBMs (named Helen, Margarita, Kaveri, Krishna, Godavari) were imported from Herrenknecht (Germany). These 5.5-meter-diameter machines were critical for 8.82 km of tunnels.
- CBTC Signaling System: Supplied by Siemens (Germany), the Yellow Line’s communication-based train control system is imported, with partial local assembly.
- 750V DC Third Rail: Core electrification components from Linxon India include imported hardware, though 70% is locally assembled.
- Rolling Stock Prototype: One CRRC train set for the Yellow Line was manufactured in China, with subsequent sets assembled in India by TRSL.
- Escalators and Elevators: Supplied by Schindler India and Johnson Lifts, with key components imported but assembled locally (60% local content).
Import vs. Make in India Table
| Component | Imported Elements | Make in India Elements | % Make in India |
|---|---|---|---|
| Rolling Stock | CRRC prototype train (China) | TRSL-assembled trains (75% local content) | 75% |
| Civil Works | None | ITD Cementation, HCC-URC, Indian firms | 100% |
| TBMs | Herrenknecht TBMs (Germany) | None | 0% |
| CBTC Signaling | Siemens core tech (Germany) | Local assembly (Siemens India) | 60% |
| Electrification | Linxon third-rail components | Local assembly (Linxon India) | 70% |
| Escalators/Elevators | Schindler/Johnson components | Local assembly | 60% |
| Tracks | None | Jindal Steel (India) | 100% |
Note: Percentages are estimates based on contract terms and industry standards.
Namma Metro Profits, Losses, and Customers Served (2011-2025)
Namma Metro Profits, Losses, and Customers Served (2011-2025)
| Financial Year | Revenue (₹ Crore) | Expenditure (₹ Crore) | Profit/Loss (₹ Crore) | Customers Served (Annual Ridership, Million) | Notes |
|---|---|---|---|---|---|
| 2011-12 | 1 (12 days) | ~10 | -9 | 2 (partial year) | Purple Line opening, Reach 1 |
| 2014-15 | ~50 | ~100 | -50 | ~7.62 (Green Line, partial) | Green Line northern section opening |
| 2019-20 | ~400 | ~450 | -50 | ~150 | Pre-COVID peak, 4.5 lakh daily riders |
| 2020-21 | ~200 | ~500 | -300 | ~50 | COVID-19 impact, reduced ridership |
| 2021-22 | ~300 | 776 | -476 | ~100 | Post-COVID recovery, high losses |
| 2022-23 | 594.02 | 486.61 | +40 | 200 | First profit, pre-depreciation |
| 2023-24 | 990 | 1,212 | -222.45 (pre-tax) | 232.8 | Threefold profit before depreciation |
| 2024-25 (Jun-Sep) | ~450 (est.) | 458 | -8 | ~70 (est., partial) | Loss before October turnaround |
| 2024-25 (Oct-Dec) | ~180 (est.) | ~169 | +14.8 | ~30 (est., partial) | Profits: ₹6.8 cr (Oct), ₹4 cr (Nov), ₹4 cr (Dec) |
| 2024-25 (Full Year, Proj.) | ~1,200 (est.) | ~1,100 (est.) | +50 to +100 (est.) | 250 (est.) | Yellow Line boost, fare hike impact, 9.08 lakh peak |
Notes:
- Revenue Sources: Include fare box collections (e.g., ₹25 crore in 10 days in July 2024), commercial activities (₹230 crore from ITBT agreements), and non-fare revenue (advertisements, station naming).
- Expenditure: Covers salaries, electricity, maintenance, loan repayments, and depreciation. Depreciation causes net losses in most years.
- Profit/Loss: Profits are pre-depreciation unless noted. The 2022-23 profit of ₹40 crore was a milestone; 2023-24 showed a pre-tax loss reduction from ₹578.09 crore to ₹222.45 crore.
- Customers Served (Ridership):
- 2011-12: 2 million for partial Purple Line operations (6.7 km, 12 days).
- 2014-15: 7.62 million for Green Line’s partial opening (first month).
- 2019-20: ~150 million based on 4.5 lakh daily riders pre-COVID.
- 2020-21: ~50 million due to COVID-19 restrictions.
- 2021-22: ~100 million during recovery.
- 2022-23: 200 million based on 5.5 lakh daily average.
- 2023-24: 232.8 million, per BMRCL data.
- 2024-25: June-Sep estimated at ~70 million (7.89 lakh daily average); Oct-Dec at ~30 million (based on 9.08 lakh peak on April 17, 2025). Full-year projection of 250 million accounts for Yellow Line’s 25,000-2 lakh daily riders.
- 2025 Ridership Highlights:
- Peak daily ridership: 9.08 lakh on April 17, 2025 (Purple Line: 4.35 lakh, Green Line: 2.85 lakh, Majestic: 1.87 lakh).
- Post-fare hike dip (February 2025): 13% drop (8.2 lakh to 7.1 lakh daily), with 20% monthly decline (2.5 crore to 2 crore).
- Recovery by June 2024: 7.89 lakh daily average, with weekday peaks at 8.5 lakh.
- Yellow Line projection: 4 lakh daily riders by 2026.
- Limitations: 2024-25 full-year data is projected due to incomplete financials. Ridership estimates use daily averages and peak figures from 2025 sources.
- Critical Analysis: Discrepancies in revenue (e.g., ₹594.02 crore vs. ₹450 crore for 2022-23) were resolved using primary BMRCL data. Ridership figures align with multiple sources but vary slightly due to reporting periods.
Conclusion
Namma Metro’s evolution from a 1977 vision to a 96.1-km network by 2025 reflects Bengaluru’s commitment to urban mobility. The Yellow Line’s ₹7,610 crore addition addresses southern congestion, but fare hikes and delays highlight challenges. With ₹42,304 crore invested across Phases 1 and 2, a ₹40 crore profit in 2022-23, and 232.8 million annual riders, Namma Metro is a transit lifeline.
Its 80% Make in India sourcing showcases local innovation, though imported TBMs and signaling tech remain critical. As Phase 3 and beyond unfold, BMRCL must balance affordability, connectivity, and sustainability to maintain public trust.

Comments